In financial markets, trends rarely move in a straight line. Instead, strong rallies are often followed by short pauses or consolidations before continuing in the same direction. One of the most reliable technical analysis tools that captures this behavior is the bull flag pattern.
The bull flag is a trend continuation chart pattern that appears after a sharp upward move. It signals that momentum is taking a brief rest before resuming higher. Recognizing it early can help traders catch powerful moves while managing risk effectively.
In this guide, we’ll cover what a bull flag is, why it forms, how to identify it, and how to trade it step by step. We’ll also explore common mistakes, variations of the pattern, and frequently asked questions.
Anatomy of a Bull Flag Pattern
A bull flag is made of three main parts:
1. The Flagpole (the strong rally)
This is the initial surge that catches traders’ attention. It often comes after positive news, a strong earnings release, a breakout from a major resistance, or simply heavy buying pressure in a trending market.
- The move is sharp, fast, and on high volume.
- Price often rises almost vertically, signaling strong conviction.
- The length of the flagpole is important, because it’s later used to calculate the potential upside target.
2. The Flag (the consolidation)
After such a rapid move, it’s natural for traders to take profits. This selling pressure leads to a short pause or pullback.
- Price typically moves sideways or slightly downward within parallel lines.
- The pullback is shallow, usually less than 50% of the flagpole. A deep retracement suggests the pattern may fail.
- Volume normally decreases during this phase, showing reduced market activity as traders wait for the next move.
3. The Breakout (the continuation)
The final step is the breakout, where price surges above the resistance created by the consolidation flag.
- A true breakout is often confirmed by increasing volume.
- This breakout signals that buyers have regained control, and the previous trend is ready to continue.
- Traders often use this moment to enter new long positions.
Why Bull Flags Form: The Market Psychology
Behind every chart pattern is market psychology. The bull flag reflects the battle between buyers and sellers during an uptrend.
- The flagpole represents overwhelming bullish enthusiasm. Buyers rush in, pushing prices sharply higher.
- The flag shows a temporary balance: sellers take profits, but they lack the strength to reverse the trend. Buyers remain confident and hold their positions.
- The breakout reveals the next wave of buying. Fresh traders enter as the price breaks resistance, adding fuel to the rally.
In essence, a bull flag signals that the uptrend is not exhausted. Instead, it’s simply pausing before the next move higher.
How to Identify a Bull Flag Pattern
Spotting a valid bull flag requires more than just noticing a pause after a rally. You need specific characteristics to confirm the setup:
- Clear Uptrend Context
The bull flag must occur within an existing bullish trend. Trying to trade flags in a sideways or bearish market lowers reliability. - Strong Flagpole
The rally should be sharp and on strong volume. Weak or gradual increases are not reliable flagpoles. - Tight Flag Consolidation
The consolidation should form a rectangular channel with parallel trendlines, sloping sideways or slightly down. Avoid flags that are too wide or choppy. - Controlled Retracement
Ideally, the flag retraces less than 50% of the flagpole. Shallow pullbacks are more bullish, while deep ones often signal weakness. - Volume Behavior
- Volume spikes during the flagpole.
- Volume declines during consolidation.
- Volume surges again during the breakout.
- Volume spikes during the flagpole.
- Timeframe
Flags can form on any timeframe, but higher ones (4-hour, daily, weekly) tend to produce more reliable signals than very short intraday patterns.
How to Trade the Bull Flag Pattern
Trading a bull flag involves clear rules for entry, stop-loss, and profit target. Here’s a step-by-step strategy:
Step 1: Entry Point
- Enter a trade once price breaks above the upper boundary of the flag.
- Aggressive traders may enter as soon as price touches resistance, but this increases risk of a false breakout.
- Conservative traders wait for a close above resistance or even a retest of the breakout level before entering.
Step 2: Stop-Loss Placement
Risk management is crucial. Common stop placements include:
- Below the lower boundary of the flag.
- Below the most recent swing low inside the consolidation.
- Slightly under a key support level, depending on your trading style.
Step 3: Profit Target
The most popular method is the measured move technique:
- Measure the length of the flagpole.
- Project that distance upward from the breakout point.
This gives you a realistic target based on the pattern’s momentum.
Alternatively, some traders prefer taking profits gradually at resistance levels or using trailing stops to capture larger trends.
Step 4: Risk Management
- Never risk more than 1–2% of your capital per trade.
- Ensure the risk-to-reward ratio is favorable (at least 1:2).
- Combine the bull flag with other tools (moving averages, RSI, Fibonacci retracement) for stronger confirmation.
Variations of the Bull Flag Pattern
Not all bull flags look the same. Some variations include:
- High-Tight Bull Flag
Extremely steep flagpole and very shallow flag. This version is rare but highly powerful, with a higher success rate. - Pennant Formation
Instead of a parallel channel, consolidation narrows into a triangle (converging lines). Still considered a continuation pattern. - Flat-Top Flag
The upper resistance is almost horizontal, with price testing it multiple times before breakout. This often leads to strong breakouts.
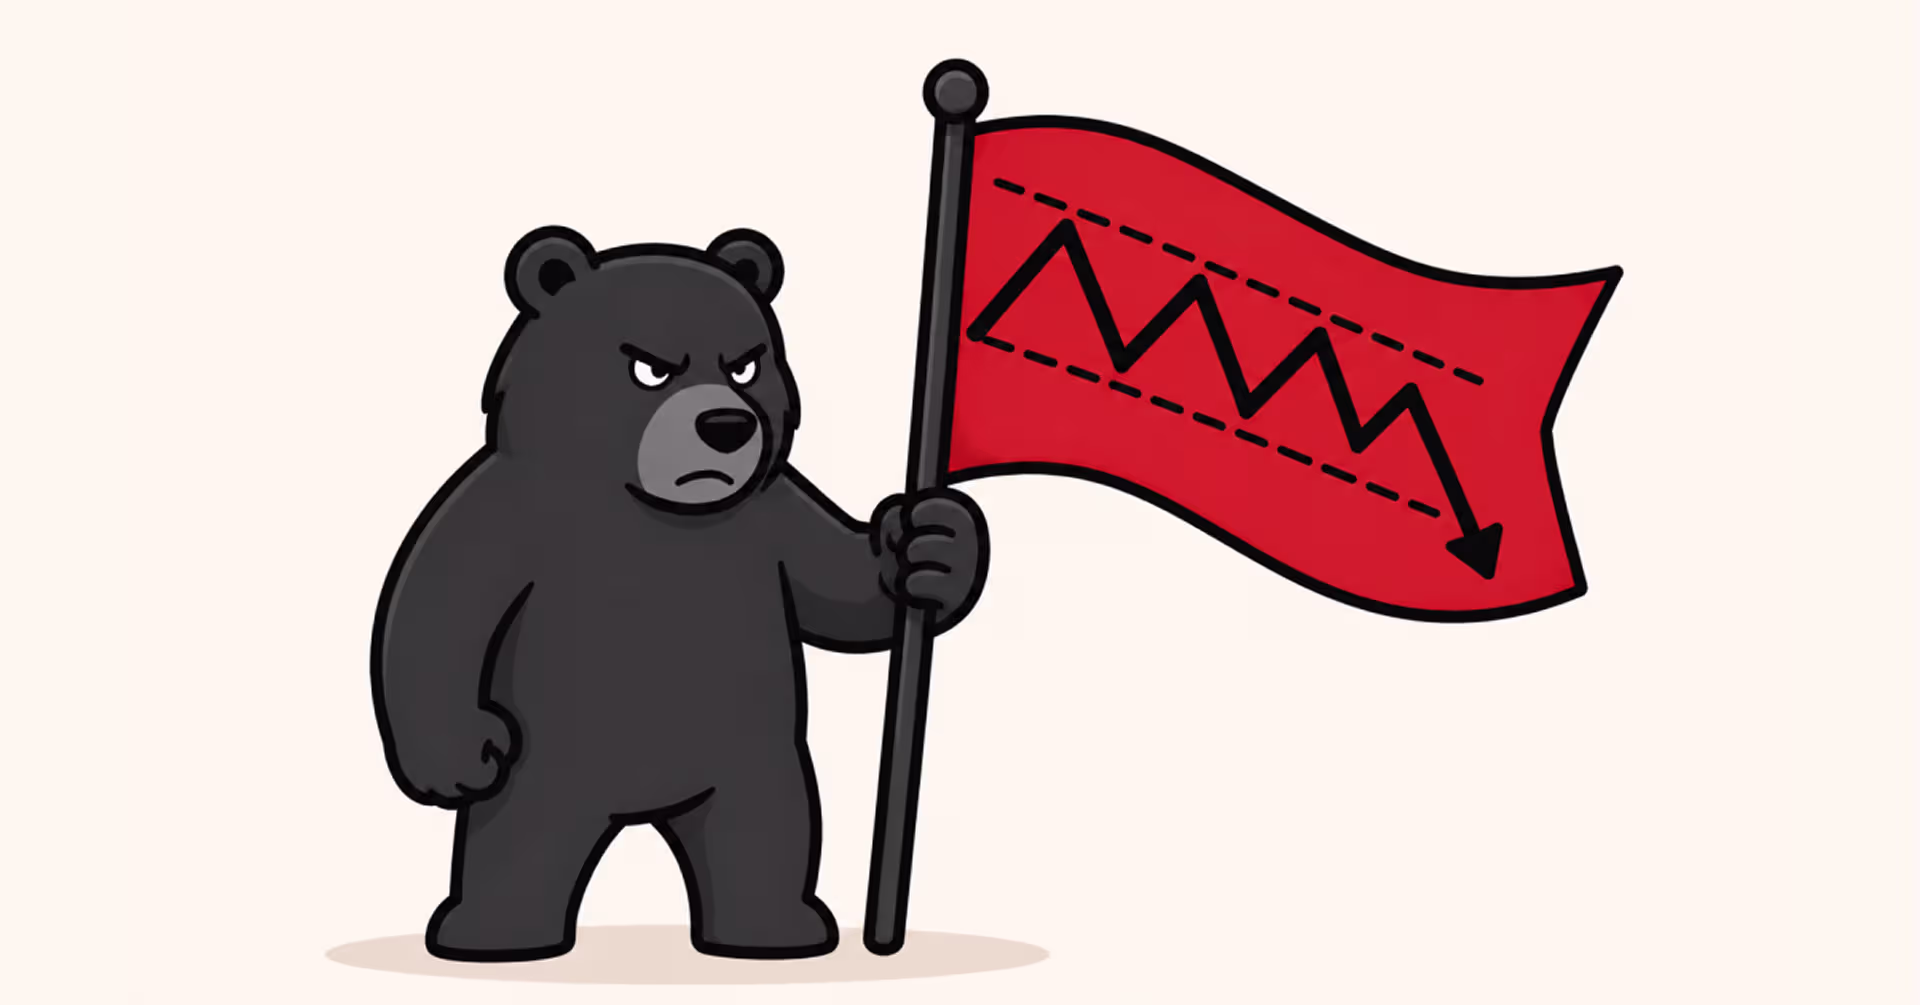
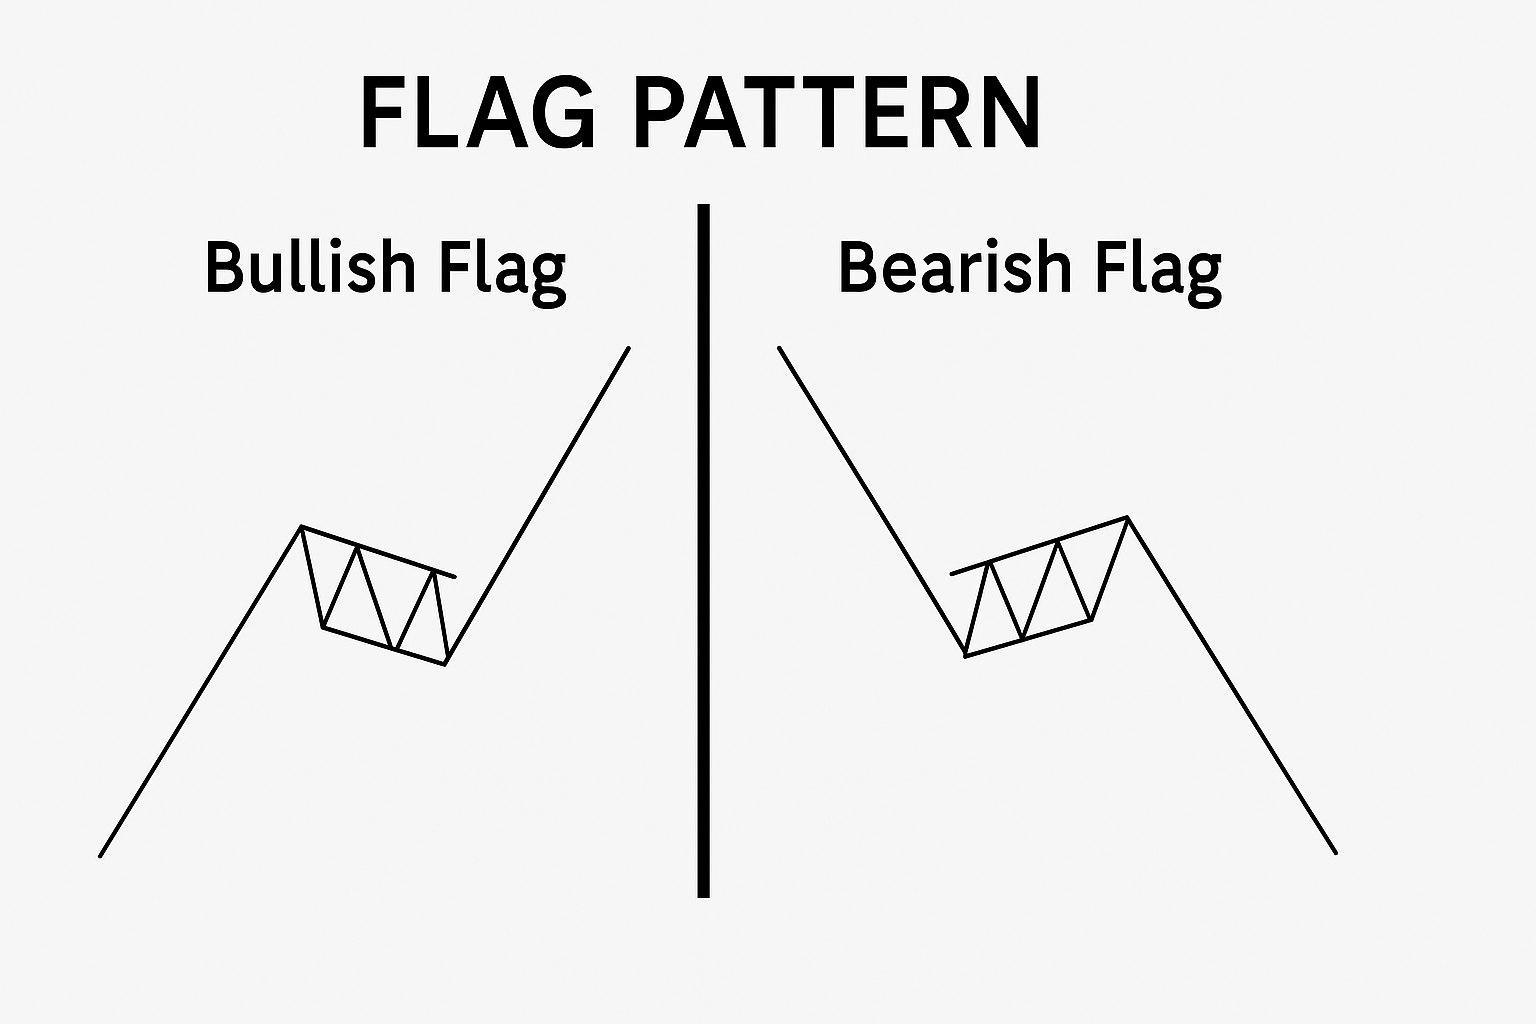
Bull Flag vs. Bear Flag
It’s important to distinguish between bullish and bearish versions of the pattern.
- Bull Flag: Strong rally, followed by downward/sideways pause, then continuation upward.
- Bear Flag: Strong decline, followed by upward/sideways pause, then continuation downward.
Both patterns represent continuation, but in opposite directions. Traders must always confirm the broader trend before acting.
Limitations of the Bull Flag
Like all chart patterns, bull flags are not foolproof. Here are some limitations:
- False Breakouts: Sometimes price breaks resistance briefly but quickly reverses. Waiting for volume confirmation helps reduce this risk.
- Deep Retracements: If consolidation retraces more than half the flagpole, the pattern is likely invalid.
- Long Consolidations: If the flag drags on too long, momentum weakens and reliability drops.
- Market Conditions: In choppy or sideways markets, bull flags are less effective.
The key is to always combine bull flag analysis with other forms of technical and fundamental analysis.
Conclusion
The bull flag pattern is one of the most powerful continuation setups in trading. It offers traders a structured way to identify trend pauses, manage entries and exits, and capture the next leg higher.
By learning to spot the flagpole, the flag, and the breakout and combining that knowledge with sound risk management, you can trade more confidently and improve your success rate.
Remember: no pattern guarantees profits. But with discipline, practice, and confirmation tools like volume, the bull flag can be a valuable weapon in any trader’s toolkit.
Learn more about Backpack
Exchange | Wallet | Twitter | Discord | Reddit
Disclaimer: This content is presented to you on an “as is” basis for general information and educational purposes only, without representation or warranty of any kind. It should not be construed as financial, legal or other professional advice, nor is it intended to recommend the purchase of any specific product or service. You should seek your own advice from appropriate professional advisors. Where the article is contributed by a third party contributor, please note that those views expressed belong to the third party contributor, and do not necessarily reflect those of Backpack. Please read our full disclaimer for further details. Digital asset prices can be volatile. The value of your investment may go down or up and you may not get back the amount invested. You are solely responsible for your investment decisions and Backpack is not liable for any losses you may incur. This material should not be construed as financial, legal or other professional advice.