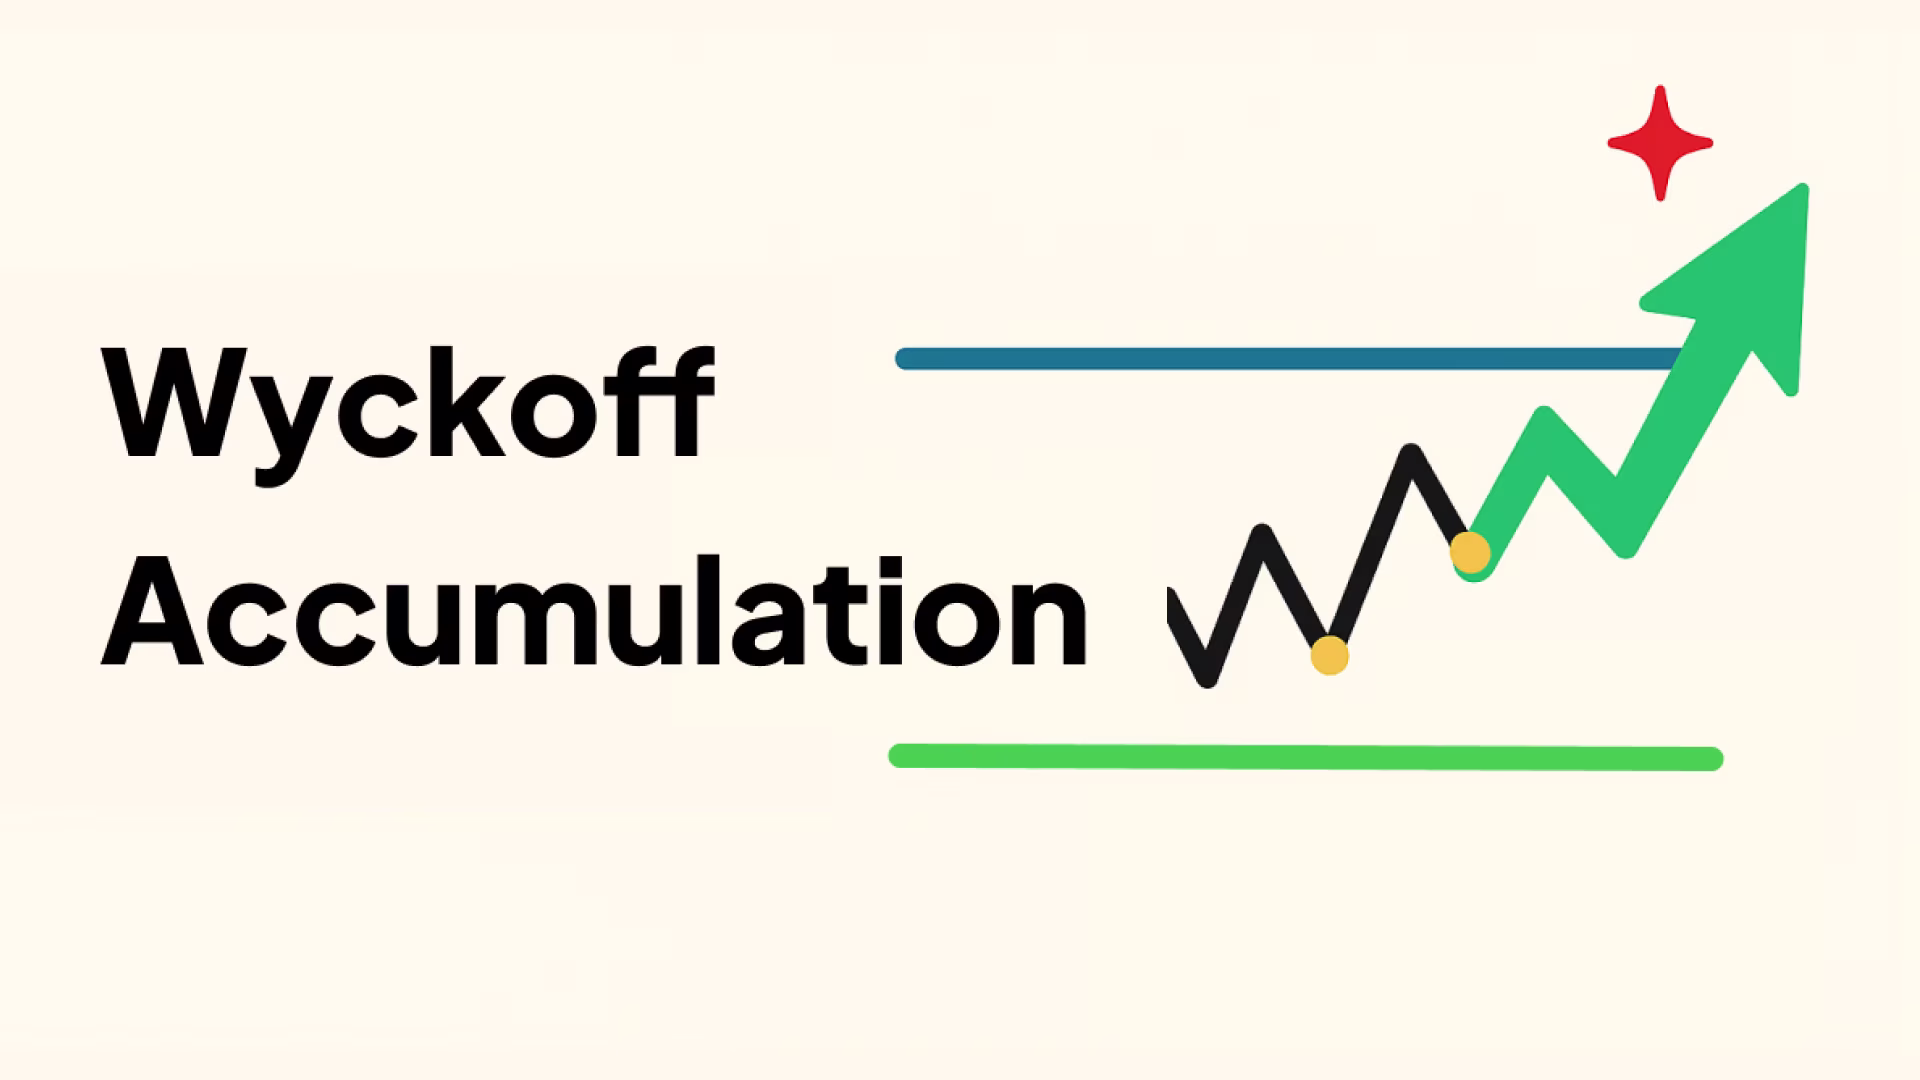
In every market cycle, prices move in waves: rising, consolidating, and falling. One of the most reliable patterns signaling the end of a downtrend and the start of a new uptrend is the Wyckoff Accumulation.
Developed by Richard D. Wyckoff in the early 20th century, this model explains how institutional investors, often called smart money, accumulate assets before a major price rally begins.
Understanding the Wyckoff Accumulation phase helps traders identify early signs of a market reversal and position ahead of broader moves.
What Is Wyckoff Accumulation?
Wyckoff Accumulation is a price behavior model that describes how large institutional investors begin buying after a significant downtrend. Instead of purchasing aggressively and driving the price higher, they accumulate gradually within a sideways range known as the trading range.
The goal of this phase is to absorb the remaining supply in the market. As selling pressure weakens and demand strengthens, price forms a base and prepares for a new upward movement, often referred to as the markup phase.
In other words, Wyckoff Accumulation reflects how smart money quietly buys while most retail traders are still bearish. Recognizing this process allows traders to position early before a breakout and the next bull cycle begins.
Key Characteristics of Wyckoff Accumulation
Wyckoff Accumulation follows a clear structure that reflects how institutional demand gradually overcomes selling pressure. While every market behaves slightly differently, the pattern often shares several defining traits.
Occurs after a downtrend
The accumulation phase typically appears at the end of a prolonged decline when selling momentum begins to slow.
Sideways price movement
Price consolidates within a horizontal range as institutions accumulate. This trading range represents a balance between buyers and sellers.
Decreasing volume during consolidation
Volume often declines as the phase develops, signaling that supply is being absorbed and fewer participants are willing to sell.
Shakeouts or false breakdowns
Temporary moves below support, known as springs, are common and serve to trigger stop-losses or remove weak holders before the next advance.
Breakout with increasing volume
When demand fully absorbs supply, price breaks out above the range with stronger volume, confirming the start of a new uptrend.
The Five Phases of Wyckoff Accumulation
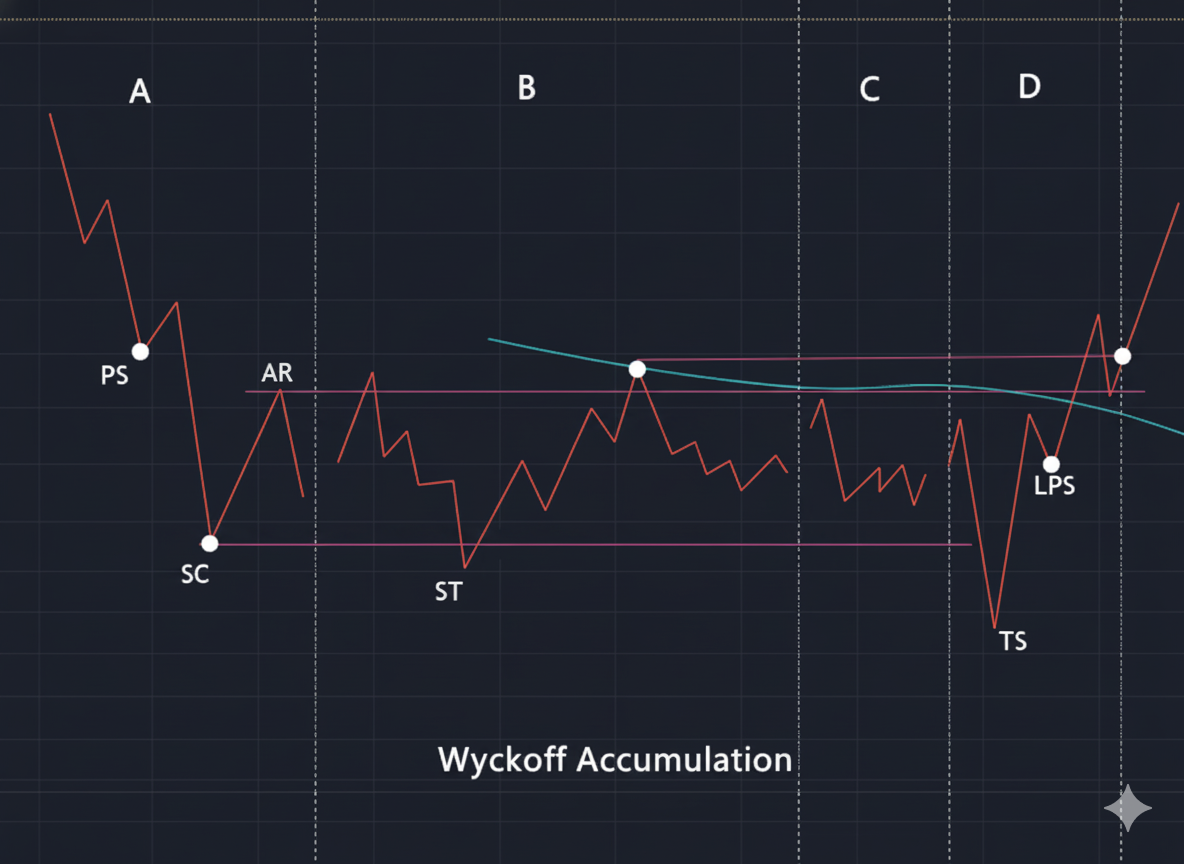
The Wyckoff Accumulation model includes five phases, labeled A to E. Each phase marks a shift in the balance between supply and demand.
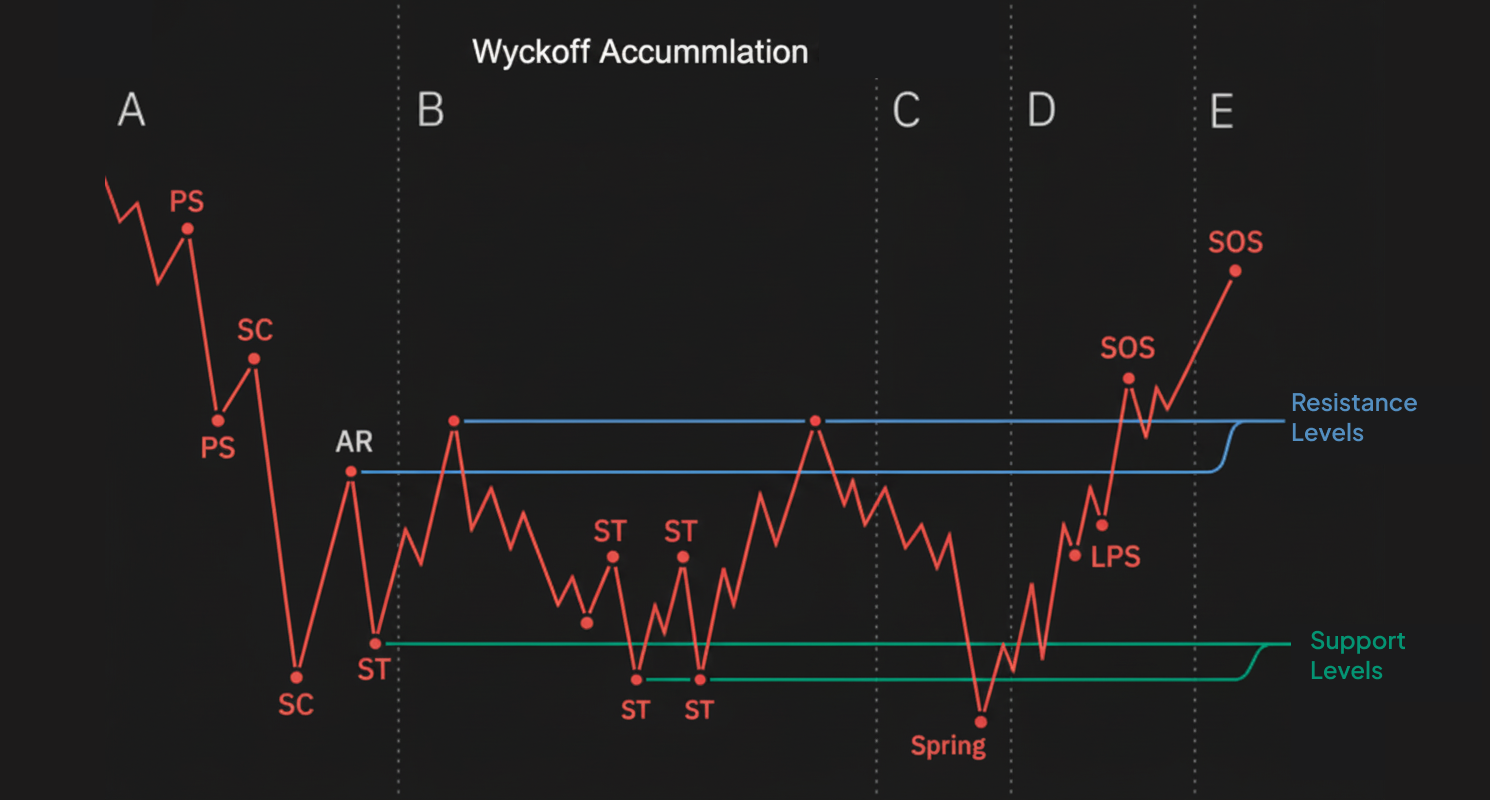
Phase A: Stopping the Downtrend
Selling pressure weakens. A Selling Climax (SC) forms the low, followed by an Automatic Rally (AR) and a Secondary Test (ST) to confirm support.
Phase B: Building a Cause
Price moves sideways as institutions absorb remaining supply. Volume gradually declines, showing reduced selling pressure.
Phase C: Spring and Test
A false breakdown below support (the Spring) shakes out weak holders. A successful Test confirms that supply is exhausted.
Phase D: Sign of Strength (SOS)
Price rallies above resistance with stronger volume. Higher lows and a Last Point of Support (LPS) confirm demand control.
Phase E: Markup Phase
The range breaks upward and a new uptrend begins, showing that accumulation is complete.
Wyckoff Accumulation vs. Wyckoff Distribution
The Wyckoff Accumulation and Wyckoff Distribution models represent opposite phases of the market cycle.
While Accumulation shows how institutional investors build positions at market bottoms, Distribution illustrates how they sell positions at market tops.
Understanding the difference between the two helps traders recognize where the market currently stands.
Recognizing the contrast between these two patterns helps traders avoid confusion between accumulation and distribution, and align their strategies with the true direction of institutional activity.
How to Trade the Wyckoff Accumulation Pattern
Trading the Wyckoff Accumulation pattern involves identifying the structure, confirming demand signals, and timing entries around key phases. The goal is to align trades with institutional activity rather than reacting to short-term volatility.
1. Identify the Trading Range
Look for a clear sideways structure forming after a strong downtrend. Mark the support and resistance zones defined by the Selling Climax (SC) and Automatic Rally (AR).
2. Wait for the Spring and Test
A Spring occurs when the price briefly dips below support to remove weak holders. A successful Test shows low volume and a quick recovery back into the range, confirming that selling pressure has diminished.
3. Confirm with Volume and Structure
During the Sign of Strength (SOS) phase, volume typically rises on rallies and decreases on pullbacks. This shift indicates that demand is overtaking supply.
4. Enter During Phase D
The most reliable entry usually comes after the Last Point of Support (LPS), when price retests support and starts to move higher. This point offers a favorable balance between risk and reward.
5. Set Stop-Loss and Targets
Place the stop-loss slightly below the Spring or LPS. Targets can be projected by measuring the height of the accumulation range and extending it upward from the breakout point.
By following these steps, traders can participate in the early stage of a new uptrend and avoid entering too early during the accumulation process.
Real-World Example
A clear example of Wyckoff Accumulation appeared in Bitcoin’s 2018–2019 market bottom.
After a sharp decline from the 2017 peak, Bitcoin formed a long trading range between 3,000 and 4,200 USD.
The Selling Climax (SC) occurred in December 2018, followed by a Spring in early 2019 that briefly broke below support before rebounding.
Once price reclaimed the range and broke above 4,200 USD in April 2019, it confirmed the start of the markup phase, leading to a rally above 13,000 USD within months. This structure closely followed the Wyckoff Accumulation pattern, demonstrating how patient institutional accumulation can precede a strong bull market recovery.
Common Mistakes to Avoid
Even experienced traders can misread the Wyckoff Accumulation pattern. Avoiding these common errors improves timing and accuracy.
Forcing the pattern: Not every sideways range is an accumulation. True setups follow clear volume and structural rules.
Ignoring volume: Valid accumulation shows lower volume during consolidation and rising volume on rallies.
Entering too early: Buying before the Spring or Last Point of Support often leads to false entries.
Confusing accumulation with re-accumulation: Re-accumulation happens in an existing uptrend, not after a downtrend.
Skipping market context: Always confirm the overall trend and market sentiment before trading.
Conclusion
The Wyckoff Accumulation pattern remains one of the most reliable frameworks for identifying market bottoms and the early stages of a new uptrend. By understanding its phases, volume behavior, and structure, traders can recognize when institutional demand is quietly returning to the market.
Applying this method helps traders avoid emotional decisions, improve entry timing, and align with the momentum of smart money rather than retail sentiment. Whether in crypto, stocks, or forex, mastering Wyckoff Accumulation provides a clear edge in spotting early reversal opportunities.
Learn more about Backpack
Exchange | Wallet | Twitter | Discord | Reddit
Disclaimer: This content is presented to you on an “as is” basis for general information and educational purposes only, without representation or warranty of any kind. It should not be construed as financial, legal or other professional advice, nor is it intended to recommend the purchase of any specific product or service. You should seek your own advice from appropriate professional advisors. Where the article is contributed by a third party contributor, please note that those views expressed belong to the third party contributor, and do not necessarily reflect those of Backpack. Please read our full disclaimer for further details. Digital asset prices can be volatile. The value of your investment may go down or up and you may not get back the amount invested. You are solely responsible for your investment decisions and Backpack is not liable for any losses you may incur. This material should not be construed as financial, legal or other professional advice.