The crypto market is highly volatile, and investor sentiment can shift rapidly between fear and optimism. The Crypto Fear and Greed Index was created to quantify that emotional cycle by assigning a numerical score to overall market psychology.
In this guide, you’ll learn what the Crypto Fear and Greed Index measures, how it is calculated, and how traders use it to interpret market conditions.
Key Takeaways
- The Crypto Fear and Greed Index measures crypto market sentiment on a scale from 0 to 100.
- It combines volatility, trading volume, social data, Bitcoin dominance, and search trends.
- Extreme Fear reflects elevated risk aversion; Extreme Greed reflects strong risk appetite.
- The index is contextual, not predictive.
- It is most effective when used alongside technical and positioning data.
What Is the Crypto Fear and Greed Index?
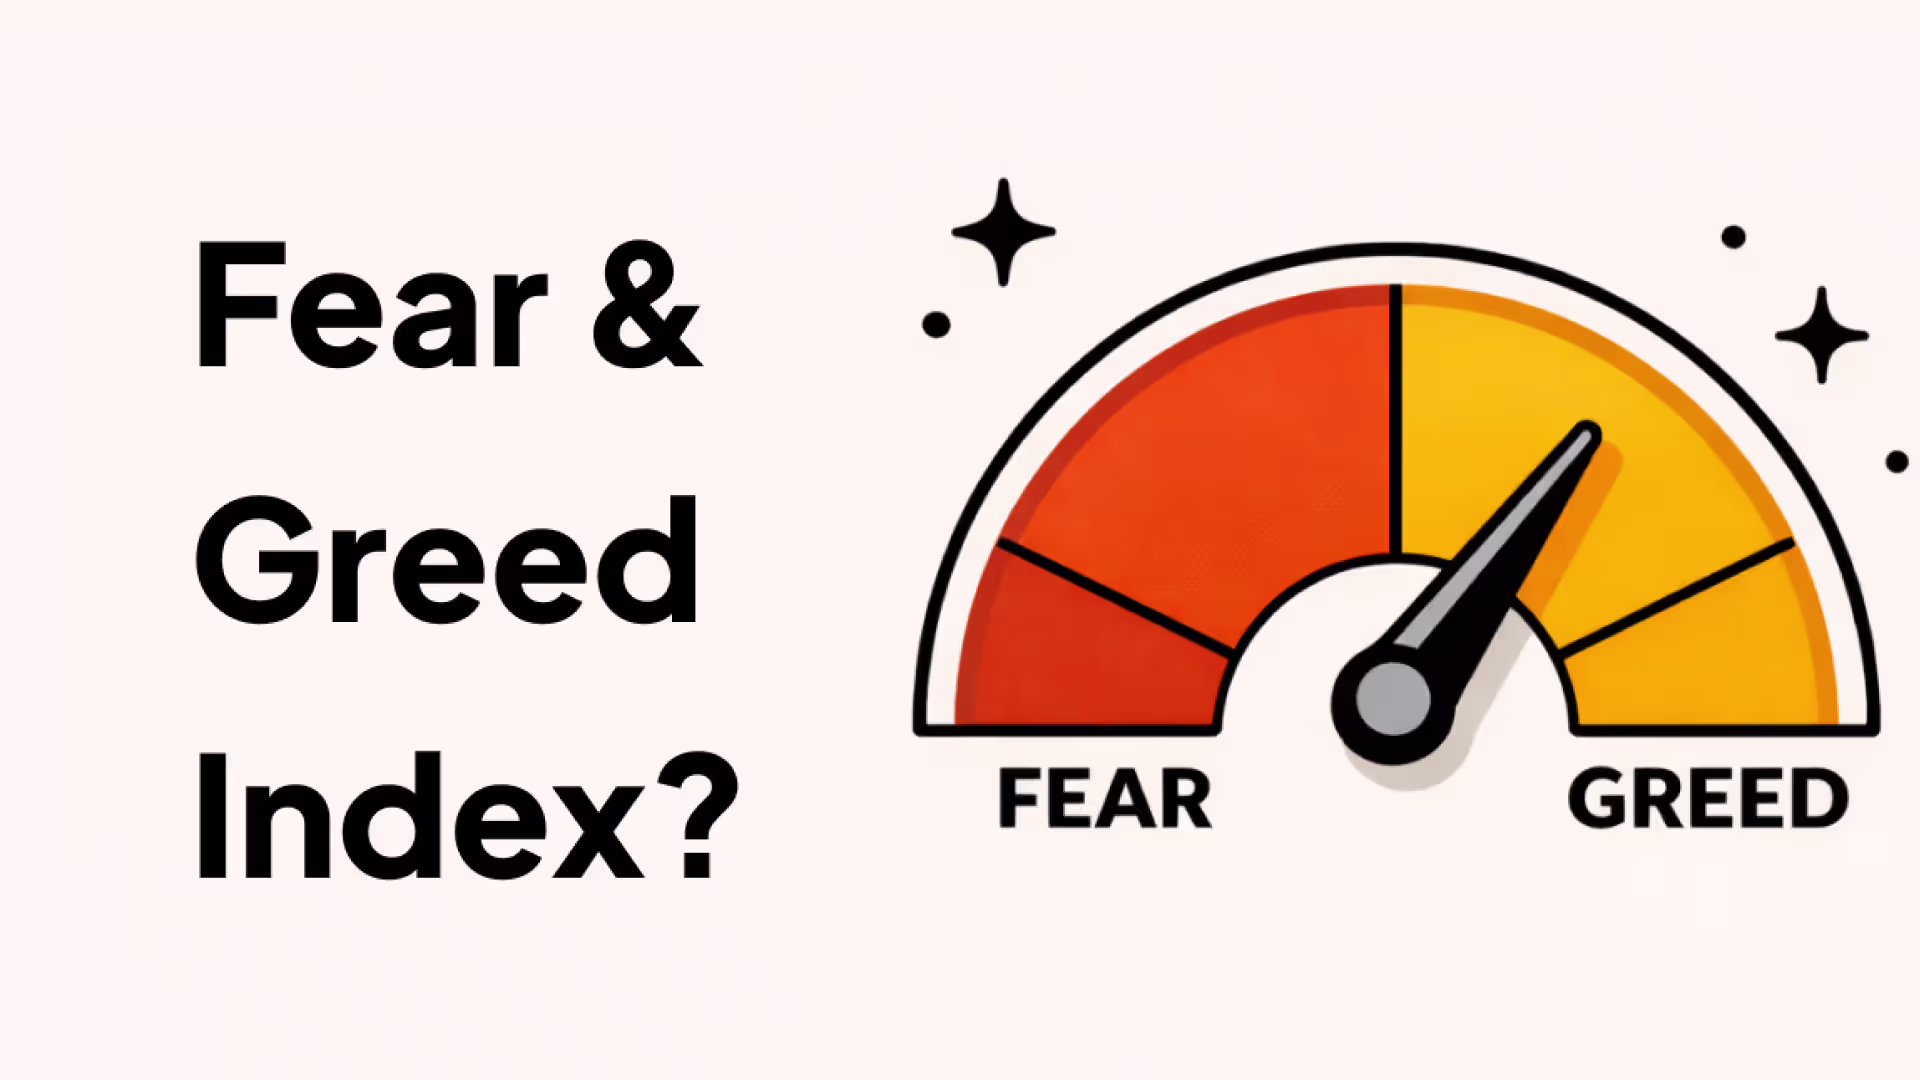
The Crypto Fear and Greed Index is a market sentiment indicator that measures the overall emotional state of cryptocurrency investors on a scale from 0 to 100.
- 0 = Extreme Fear: reflects heightened risk aversion and strong selling pressure
- 100 = Extreme Greed: reflects elevated risk appetite and aggressive buying behavior
The index is commonly divided into five sentiment zones:
The most widely referenced version of the Crypto Fear and Greed Index is published by Alternative.me. While different platforms may use variations in methodology or data weighting, the objective remains the same: to provide a simplified numerical representation of current crypto market sentiment.
The concept was adapted from the CNN Fear & Greed Index used in traditional equity markets and adjusted to reflect the structure and continuous trading nature of cryptocurrency markets.
Why Does Market Sentiment Matter?
Market sentiment plays a significant role in cryptocurrency price movements. Unlike traditional equity markets, where earnings reports or macroeconomic policy can provide valuation anchors, crypto assets are often more sensitive to liquidity cycles, narrative shifts, and investor positioning.
Two broad psychological forces typically shape short-term market behavior:
Fear
Periods of rapid price declines can increase risk aversion. Investors may reduce exposure, leading to additional selling pressure and, in some cases, forced liquidations.
Greed
During strong upward trends, rising prices can increase risk appetite. Market participants may increase exposure, sometimes at stretched valuations, which can elevate the probability of volatility or pullbacks.
Sentiment indicators such as the Crypto Fear and Greed Index attempt to quantify these psychological extremes. By translating collective behavior into a measurable score, the index provides additional context for interpreting price action.
How Is the Crypto Fear and Greed Index Calculated?
The Crypto Fear and Greed Index is constructed using multiple data inputs, each assigned a weight within the overall scoring framework. The exact methodology may evolve over time depending on data availability, but the most widely referenced version includes the following components:
Volatility (approximately 25%)
Volatility is measured by comparing current Bitcoin price movements against 30-day and 90-day averages. Elevated volatility, particularly during sharp declines, is typically associated with increased market fear.
Market Momentum and Volume (approximately 25%)
This component evaluates current trading volume and momentum relative to historical averages. Strong upward momentum combined with elevated volume may reflect increased risk appetite, while weakening momentum may suggest caution.
Social Media Activity (approximately 15%)
Social engagement and sentiment across crypto-related discussions are monitored to assess shifts in retail participation and narrative intensity. Elevated interaction levels often coincide with heightened enthusiasm, while declining engagement may indicate reduced market interest.
Bitcoin Dominance (approximately 10%)
Bitcoin dominance measures BTC’s share of total crypto market capitalization. Rising dominance can reflect capital rotation into Bitcoin during risk-off periods, whereas declining dominance may signal increased allocation to higher-risk assets.
Google Trends Data (approximately 10%)
Search volume trends for Bitcoin and related queries are used as a proxy for public interest. Spikes in certain search patterns may reflect shifts in broader retail attention.
Surveys (historically approximately 15%, currently limited or paused)
Some earlier versions incorporated investor surveys to directly measure sentiment. This component is not consistently active in current calculations.
Different platforms may apply alternative weightings or include additional metrics such as derivatives positioning data or stablecoin-based indicators. As a result, index values may vary slightly across providers.
How to Read the Index: Practical Context
Interpreting the Crypto Fear and Greed Index requires context. The score reflects prevailing sentiment conditions but does not predict exact turning points.
Extreme Fear (0–24)
Extreme Fear reflects heightened risk aversion across the market. This environment often coincides with sharp price declines, elevated volatility, and reduced risk appetite.
In some historical cases, prolonged periods of Extreme Fear have occurred near broader market lows, including during major macro or industry stress events such as the March 2020 market selloff and the November 2022 exchange crisis. However, sentiment can remain depressed for extended periods before price stabilization occurs.
From a positioning perspective, some traders interpret Extreme Fear as a signal that risk may be elevated but that capitulation dynamics could be developing. It is not a timing tool, but rather a measure of prevailing pessimism.
Extreme Greed (75–100)
Extreme Greed reflects elevated optimism and strong risk appetite. This environment typically coincides with sustained price momentum and increased speculative activity.
Historically, extended periods of Extreme Greed have occurred during late-stage bullish phases. In prior cycles, elevated sentiment readings have preceded periods of consolidation or correction, though not necessarily immediately.
From a risk management perspective, some traders treat Extreme Greed as a reminder to reassess leverage, position sizing, or exposure. Elevated sentiment suggests that market expectations may already be high.
How to Use the Fear and Greed Index in Trading
The Crypto Fear and Greed Index is best used as a contextual indicator rather than a standalone trading signal. It provides insight into prevailing market psychology but should be interpreted alongside other analytical tools.
Use It as Confirmation, Not a Trigger
Sentiment data may strengthen an existing thesis derived from technical or fundamental analysis. For example, oversold technical conditions combined with Extreme Fear may indicate elevated pessimism, but this does not guarantee reversal.
Evaluate Historical Context
The same index reading can carry different implications depending on broader market conditions. A score of 30 during a prolonged bear market may reflect structural weakness, while the same reading during a strong uptrend may represent a temporary pullback.
Consider Time Horizon
Because the index aggregates daily data, it is generally more relevant for swing or position-based decision-making than for intraday trading strategies.
Monitor Sentiment Shifts
Rapid changes in sentiment may follow significant market events such as regulatory developments, macroeconomic announcements, or industry disruptions. Tracking changes over time can provide additional context.
Combine with Positioning and Liquidity Metrics
Sentiment indicators are often used alongside derivatives positioning data such as funding rates, open interest, and liquidation levels to better understand market structure and leverage conditions.
Limitations of the Crypto Fear and Greed Index
Like any market indicator, the Crypto Fear and Greed Index has structural limitations that should be considered when interpreting its signals.
It Is Backward-Looking
The index reflects recent price behavior, volatility, and sentiment data. As a result, it often confirms prevailing conditions rather than forecasting future price movements.
Sentiment Extremes Can Persist
Markets can remain in Extreme Greed or Extreme Fear for extended periods, particularly during strong bull or bear cycles. Elevated or depressed readings do not automatically imply an imminent reversal.
It Is Largely Bitcoin-Centric
Most widely referenced versions of the index are primarily derived from Bitcoin-related metrics. As a result, the reading may not accurately represent sentiment for specific altcoins or niche sectors.
It Does Not Measure Fundamentals
The index captures emotional and behavioral signals, not intrinsic value. An asset may trade in an environment of Extreme Fear despite stable fundamentals, or in Extreme Greed despite elevated valuation risk.
Conclusion
The Crypto Fear and Greed Index provides a simplified framework for understanding shifts in crypto market sentiment. By translating volatility, volume, dominance, and behavioral data into a single score, it offers a structured way to interpret emotional extremes in the market.
However, sentiment alone does not determine price direction. Extreme readings can persist, and market conditions are shaped by liquidity, macroeconomic factors, and positioning dynamics. For that reason, the index is most effective when used alongside technical analysis, derivatives positioning data, and broader market context.
Rather than predicting precise tops or bottoms, the Fear and Greed Index helps traders remain aware of collective psychology. In highly volatile markets, that awareness can be as important as any price-based indicator.
Learn more about Backpack
Exchange | Wallet | Twitter | Discord | Reddit
Disclaimer: This content is presented to you on an “as is” basis for general information and educational purposes only, without representation or warranty of any kind. It should not be construed as financial, legal or other professional advice, nor is it intended to recommend the purchase of any specific product or service. You should seek your own advice from appropriate professional advisors. Where the article is contributed by a third party contributor, please note that those views expressed belong to the third party contributor, and do not necessarily reflect those of Backpack. Please read our full disclaimer for further details. Digital asset prices can be volatile. The value of your investment may go down or up and you may not get back the amount invested. You are solely responsible for your investment decisions and Backpack is not liable for any losses you may incur. This material should not be construed as financial, legal or other professional advice.