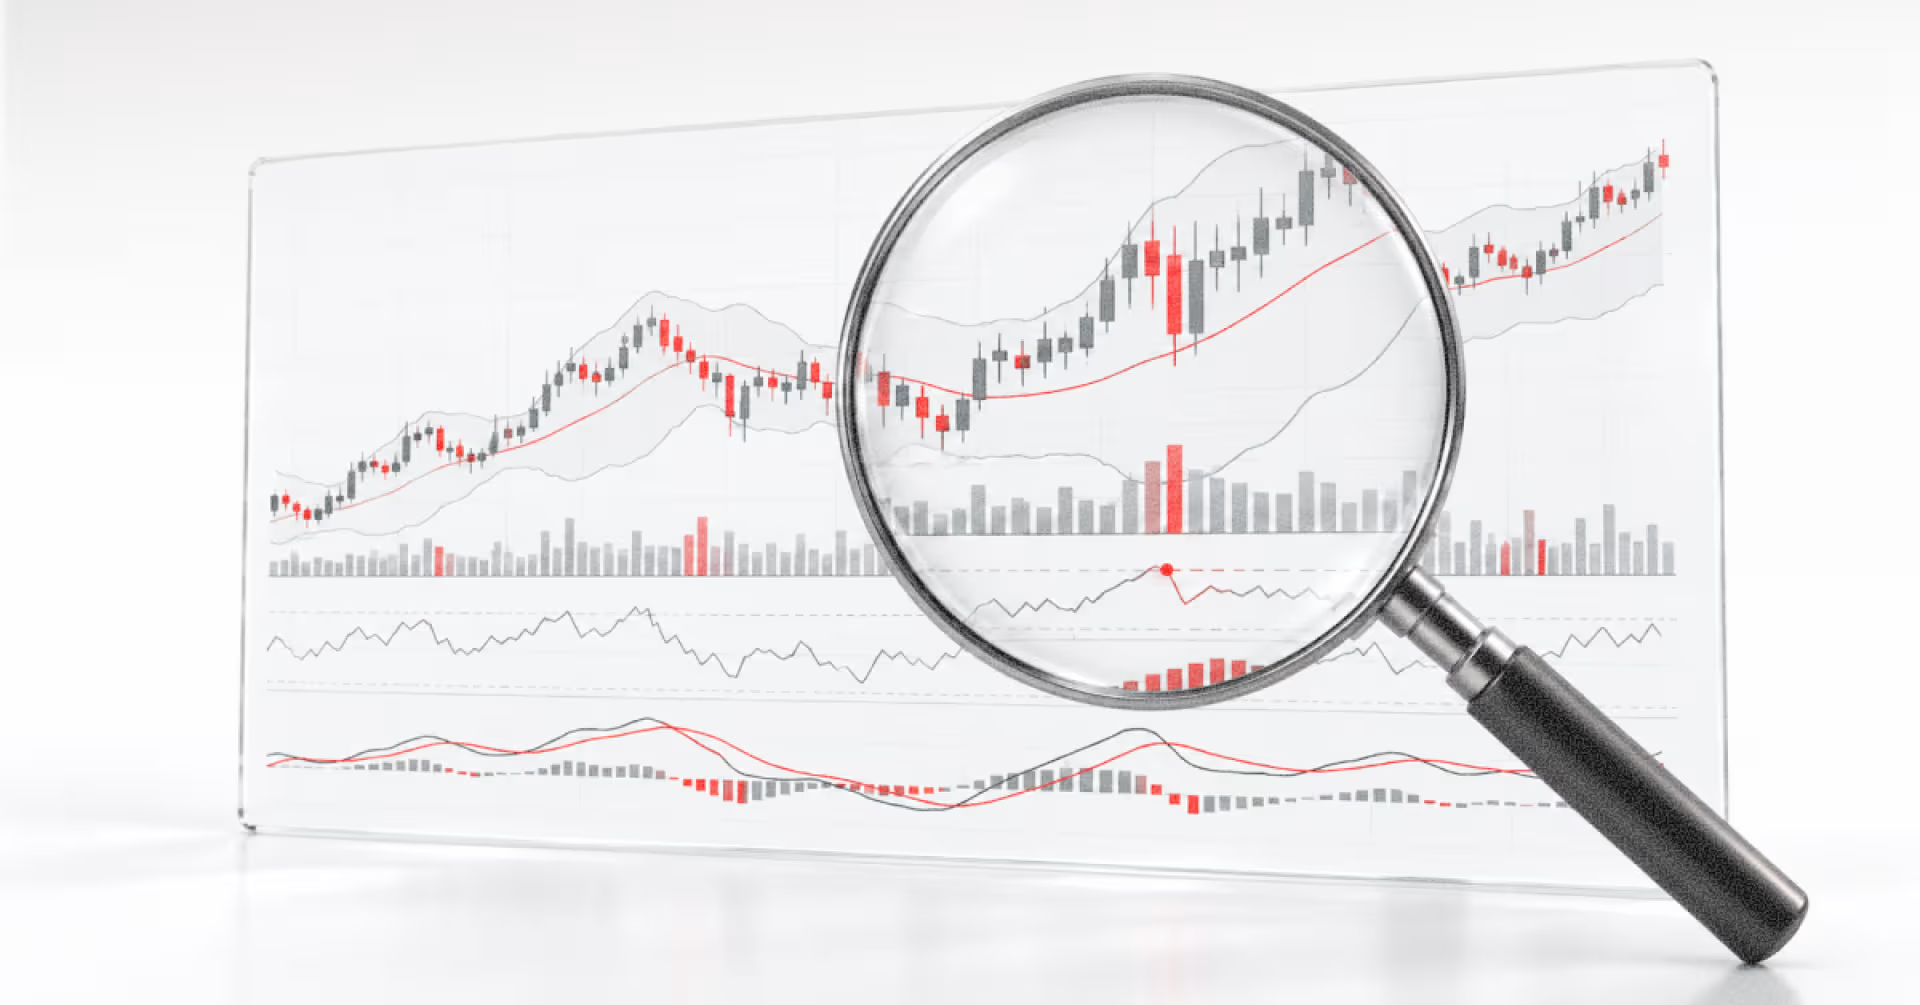
Technical indicators are mathematical tools built from price, volume, or volatility data that traders use to summarize market behavior. Moving averages, the Relative Strength Index (RSI), Moving Average Convergence Divergence (MACD), Bollinger Bands, and volume can help traders evaluate trend, momentum, volatility, and market participation. No technical indicator can predict future prices with certainty.
Key Facts
- A moving average averages price over a set number of periods, and the 50-period and 200-period versions are the two most widely watched for trend.
- RSI is calculated over 14 periods by default and plotted from 0 to 100, where 70 and 30 are the conventional overbought and oversold reference levels.
- MACD is built from the 12-period and 26-period EMAs with a 9-period signal line, and traders watch where the MACD line crosses that signal line.
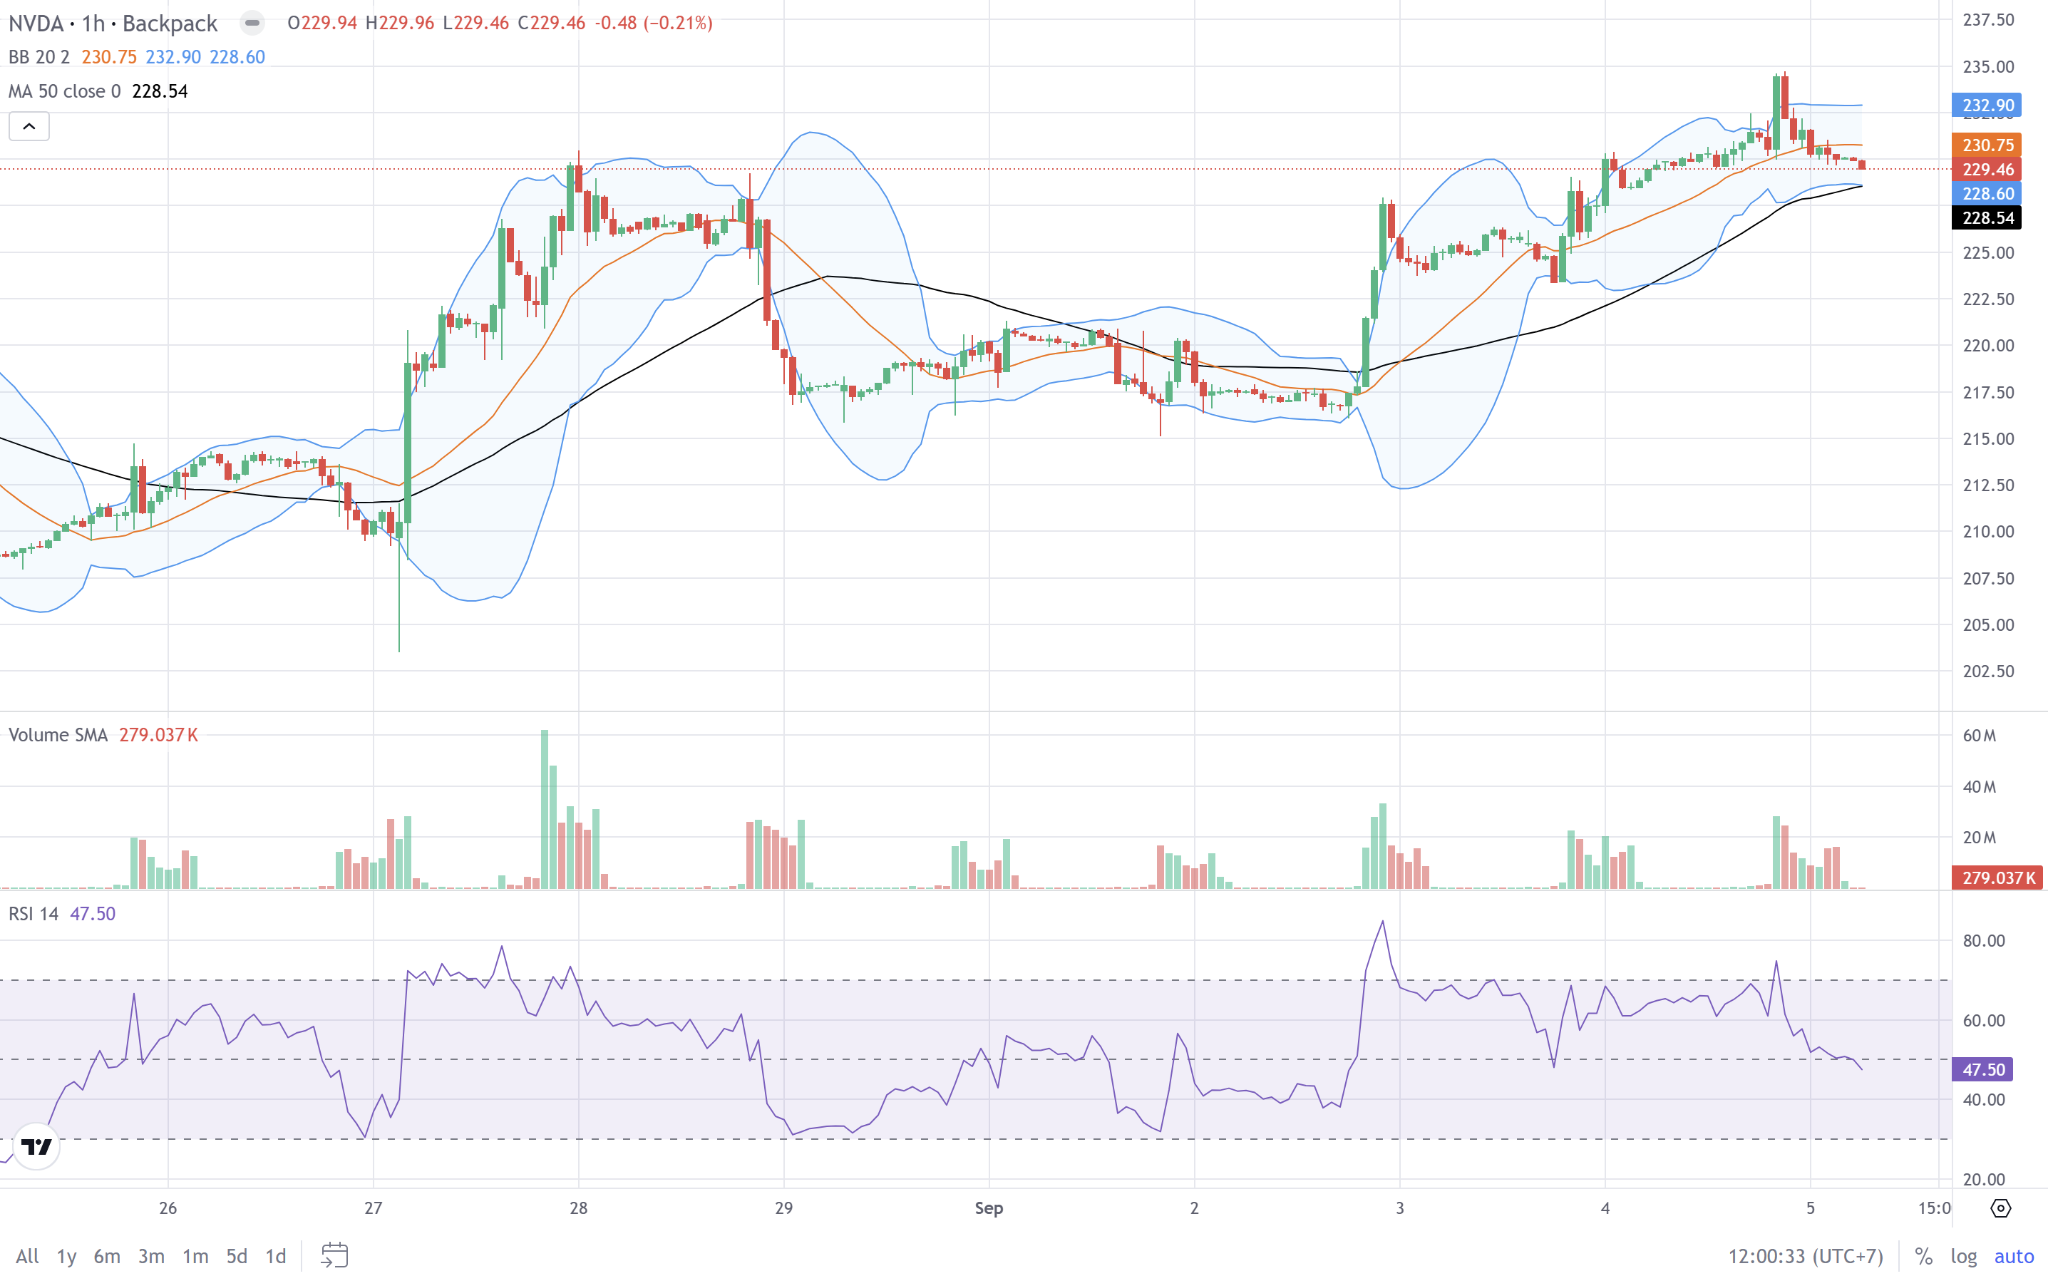
- Bollinger Bands sit 2 standard deviations above and below a 20-period moving average, so the gap between them widens as the market becomes more volatile.
- Volume counts how much of an asset changed hands in a period, and in crypto that figure differs by exchange and trading pair, so it is read against a venue's own history rather than across venues.
- Every indicator here is built from past data, so a threshold or a crossover marks a condition worth checking, not a trade to take.
What Are Technical Indicators?
Technical indicators are formulas applied to a market's own trading record: open, high, low, close, and volume, plus the number of periods you calculate them over. Nothing else goes in, which is why several indicators on one chart are often different views of the same underlying data.
Indicators are usually grouped by what they measure:
- Trend indicators such as moving averages describe direction.
- Momentum indicators such as RSI and MACD describe how fast recent moves have been.
- Volatility indicators such as Bollinger Bands describe how widely price is ranging.
- Volume indicators describe how much participation stands behind a move.
Because every input is historical, every indicator lags to some degree: it confirms a condition after that condition has already started. Faster settings react sooner but produce more false readings, slower settings are steadier but arrive later. That tradeoff does not disappear, so settings are worth choosing deliberately instead of leaving them at default.
1. What Is a Moving Average?
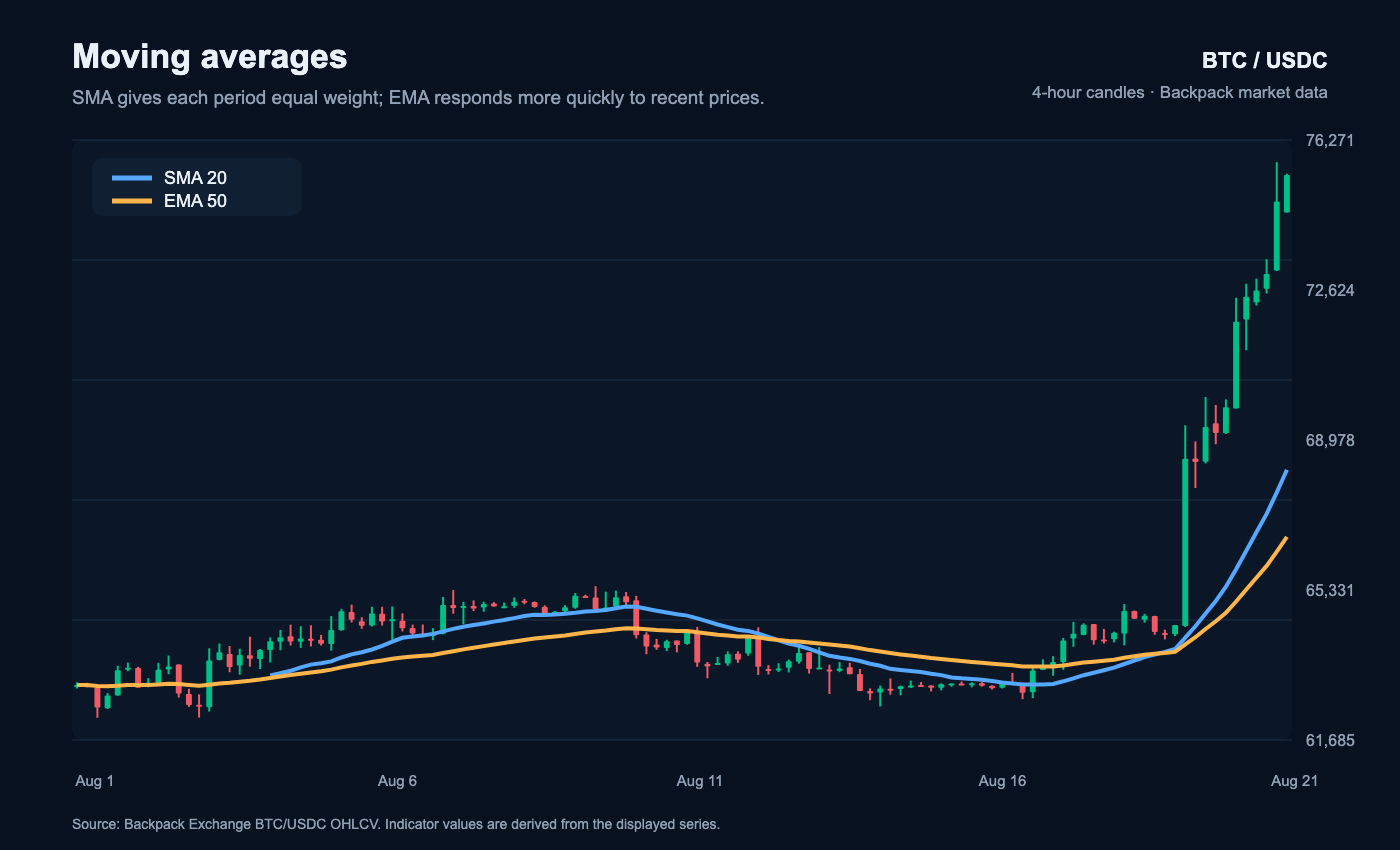
A moving average calculates the average price over a chosen number of periods. As each new period is added, the oldest observation drops out, creating a rolling average.
The two most common types are the simple moving average (SMA) and exponential moving average (EMA). An SMA gives each period equal weight, while an EMA gives more weight to recent prices.
Traders commonly use moving averages to identify trend direction, most often with the 50-period average for the medium term and the 200-period for the long term. Price consistently above a rising average can indicate an uptrend, while price below a falling average can indicate a weaker trend.
Moving-average crossovers compare a shorter-term average with a longer-term average. They can help show changing momentum, but because moving averages lag price, crossovers can arrive late and generate false signals in sideways markets.
2. What Is the Relative Strength Index (RSI)?
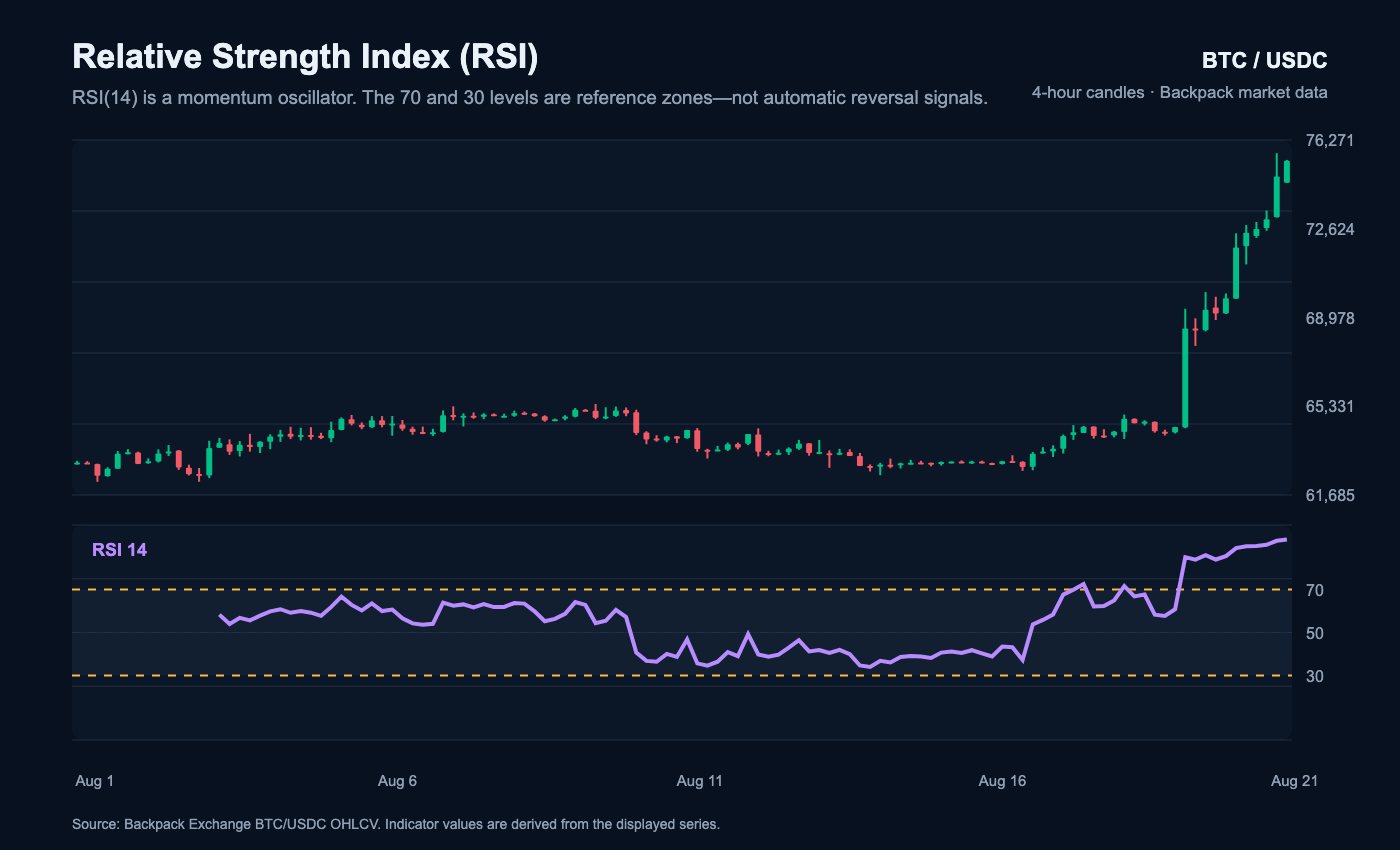
The Relative Strength Index is a momentum oscillator that compares the magnitude of recent gains with recent losses over a set lookback period, 14 by default. RSI is generally plotted from 0 to 100.
Many traders use levels near 70 and 30 as reference points for overbought and oversold conditions. These labels are not automatic reversal signals. Strong trends can keep RSI elevated or depressed for extended periods, which is why some traders read the midpoint at 50 as a rough dividing line between bullish and bearish momentum instead.
RSI can also show divergence. If price makes a new high while RSI makes a lower high, momentum may be weakening; if price makes a new low while RSI makes a higher low, selling pressure may be fading. Divergence can be informative, but it can persist without producing an immediate reversal.
3. What Is MACD?
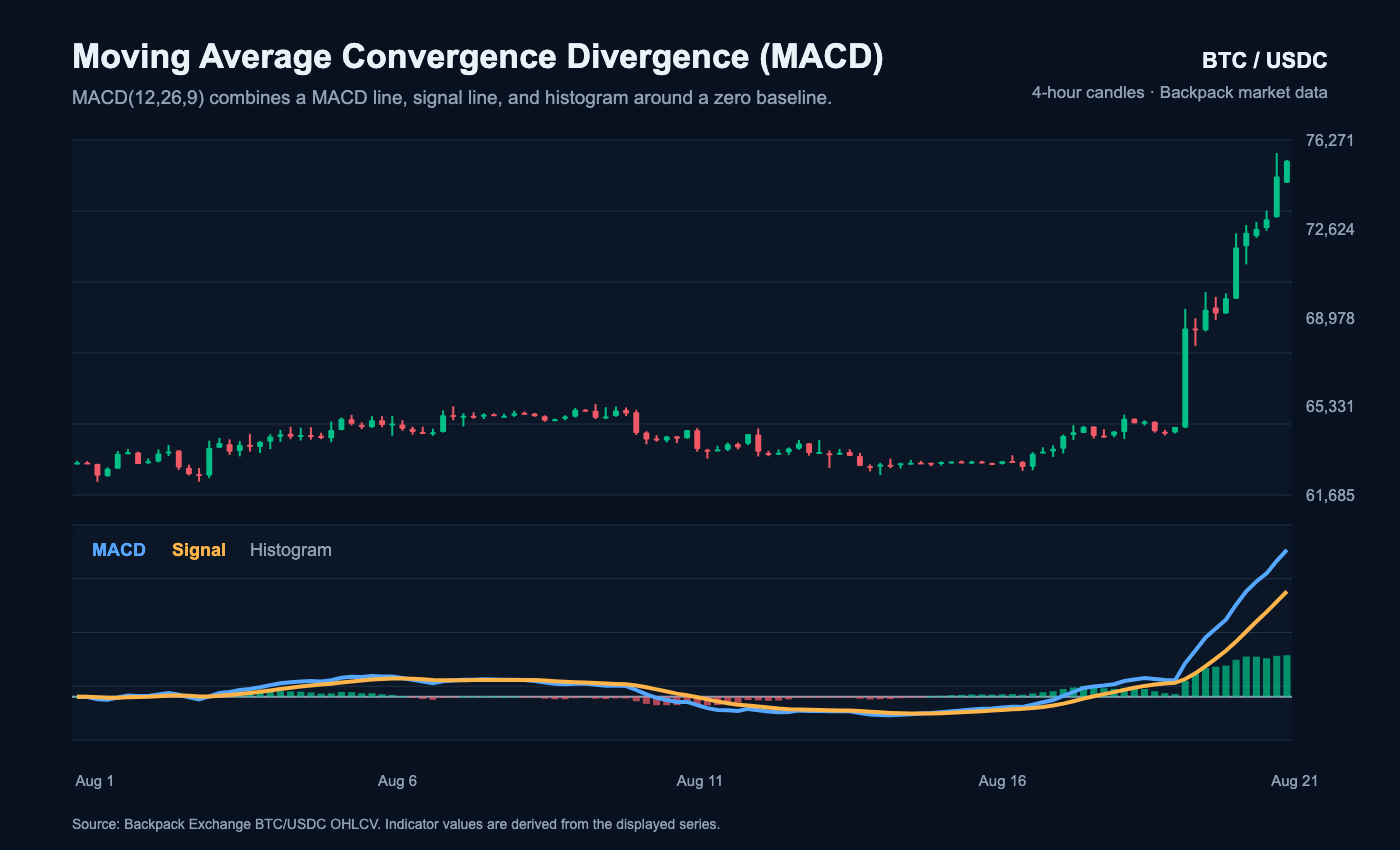
Moving Average Convergence Divergence, or MACD, is a trend-following momentum indicator built from exponential moving averages. The MACD line is the 12-period EMA minus the 26-period EMA, so it measures the gap between a fast and a slow average.
A standard MACD display includes a MACD line, a signal line that is a 9-period EMA of the MACD line, and a histogram showing the distance between them. Traders often watch line crossovers, movement above or below zero, and changes in histogram momentum. The zero line is where the two EMAs meet, so a MACD line above zero means the faster average is running ahead of the slower one.
A bullish crossover occurs when the MACD line rises above the signal line. A bearish crossover occurs when it moves below. These signals can highlight changing momentum but can become noisy when the market lacks a clear trend.
4. What Are Bollinger Bands?
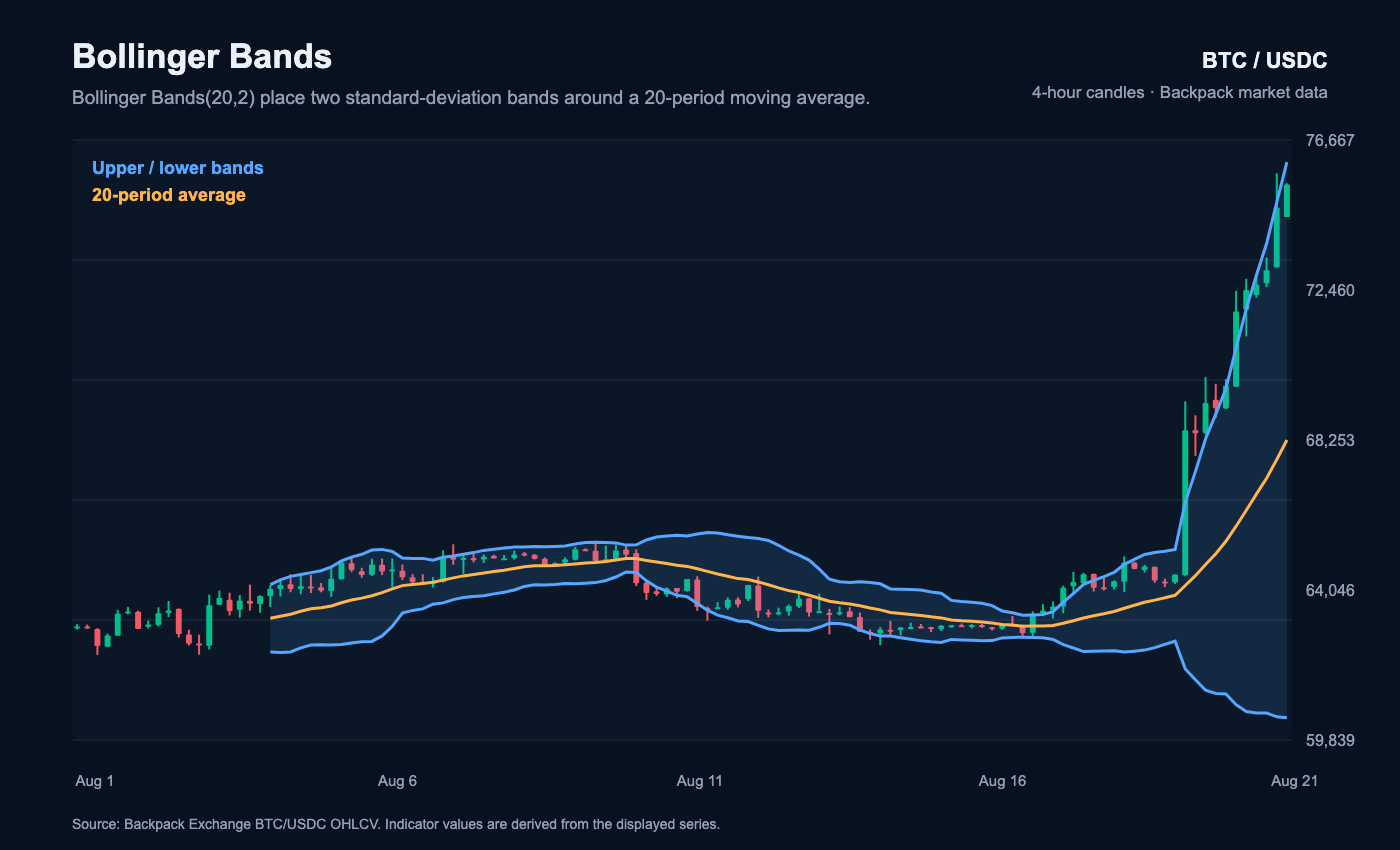
Bollinger Bands place an upper and lower band around a moving average using a volatility measure based on standard deviation. The standard setting is a 20-period moving average with the bands 2 standard deviations above and below it, so the middle band is itself a trend reference.
When volatility rises, the bands generally widen. When volatility falls, they contract. This helps traders identify periods of volatility expansion and compression.
Price touching an upper band does not automatically mean an asset is overbought, and touching a lower band does not automatically mean it is oversold. In strong trends, price can repeatedly move along one band.
A commonly watched pattern is the "squeeze," where the bands become unusually narrow before volatility expands. A squeeze highlights low volatility; it does not predict the direction of the next move.
5. How Do Traders Use Volume?
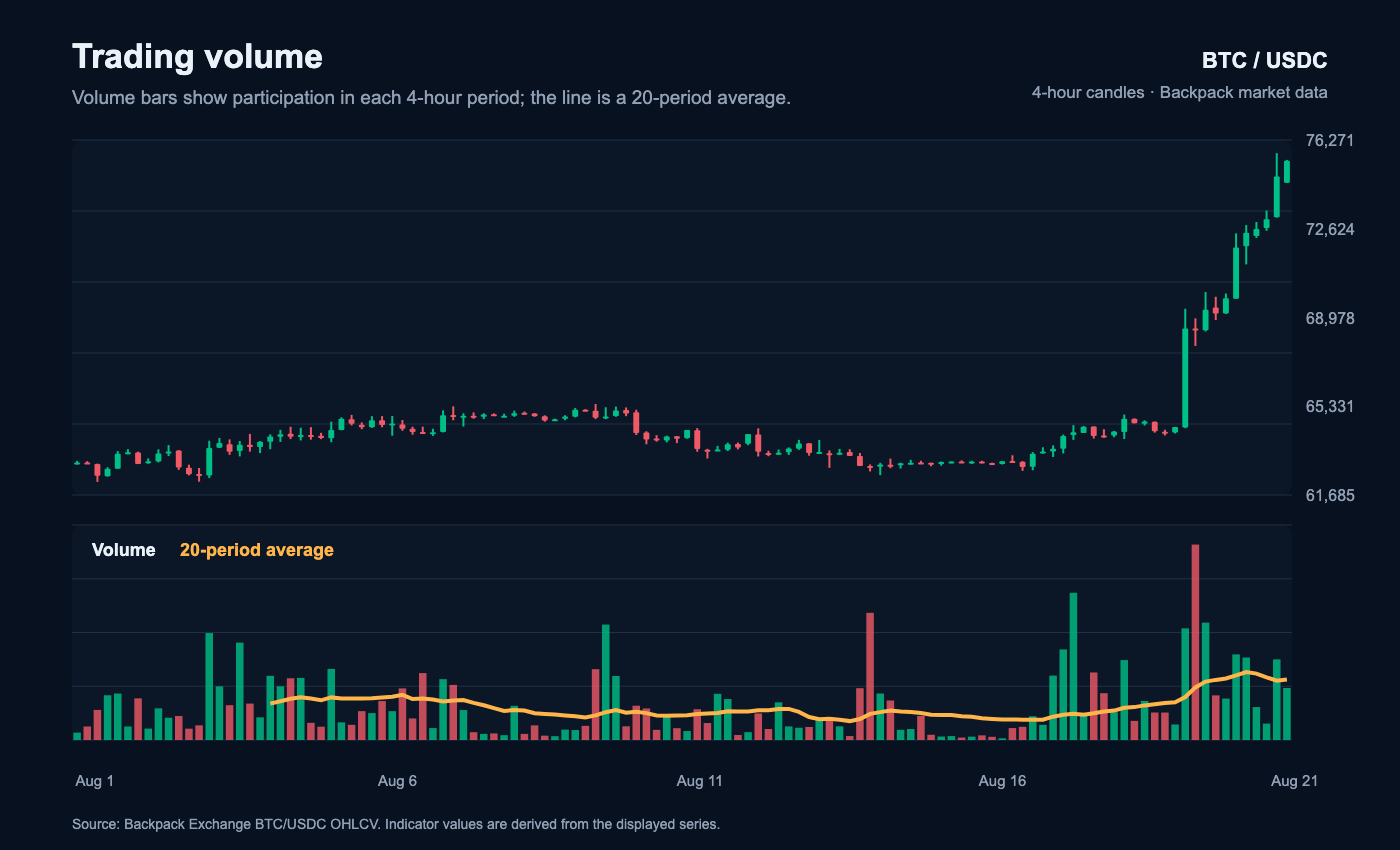
Volume measures how much of an asset changes hands during a period. In crypto, reported volume can differ across exchanges and trading pairs, so it is read against a venue's own recent history rather than compared across venues.
Traders use volume to evaluate participation, usually by comparing each period against a moving average of volume rather than judging the raw number. A breakout accompanied by strong volume may be viewed as more broadly supported than a price move on unusually light activity.
Volume can also help identify possible exhaustion. If price continues making new highs while participation fades, traders may investigate whether momentum is weakening.
Derived tools include On-Balance Volume, which accumulates volume by direction, volume-weighted average price, which gives an average execution level for the session, and volume profiles, which show volume by price level rather than by time. Each answers a different question, so volume should not be treated as one universal signal.
How Should Traders Combine Technical Indicators?
Using more indicators does not automatically improve analysis. Many indicators measure similar information, so stacking several momentum tools can create the appearance of confirmation while repeating the same underlying signal.
Combining them works best when they are read in a fixed order: trend first to decide which direction to trade with, then momentum to judge whether that move still has force, then volatility and volume to size the risk around it. Reading them in the same order every time is what makes two charts comparable.
Indicators will often disagree, and that disagreement is itself information. A rising trend line alongside weakening momentum describes a move losing force, not a contradiction to resolve by adding a sixth indicator.
The goal is a consistent decision framework rather than a perfect signal.
Technical Indicator Example
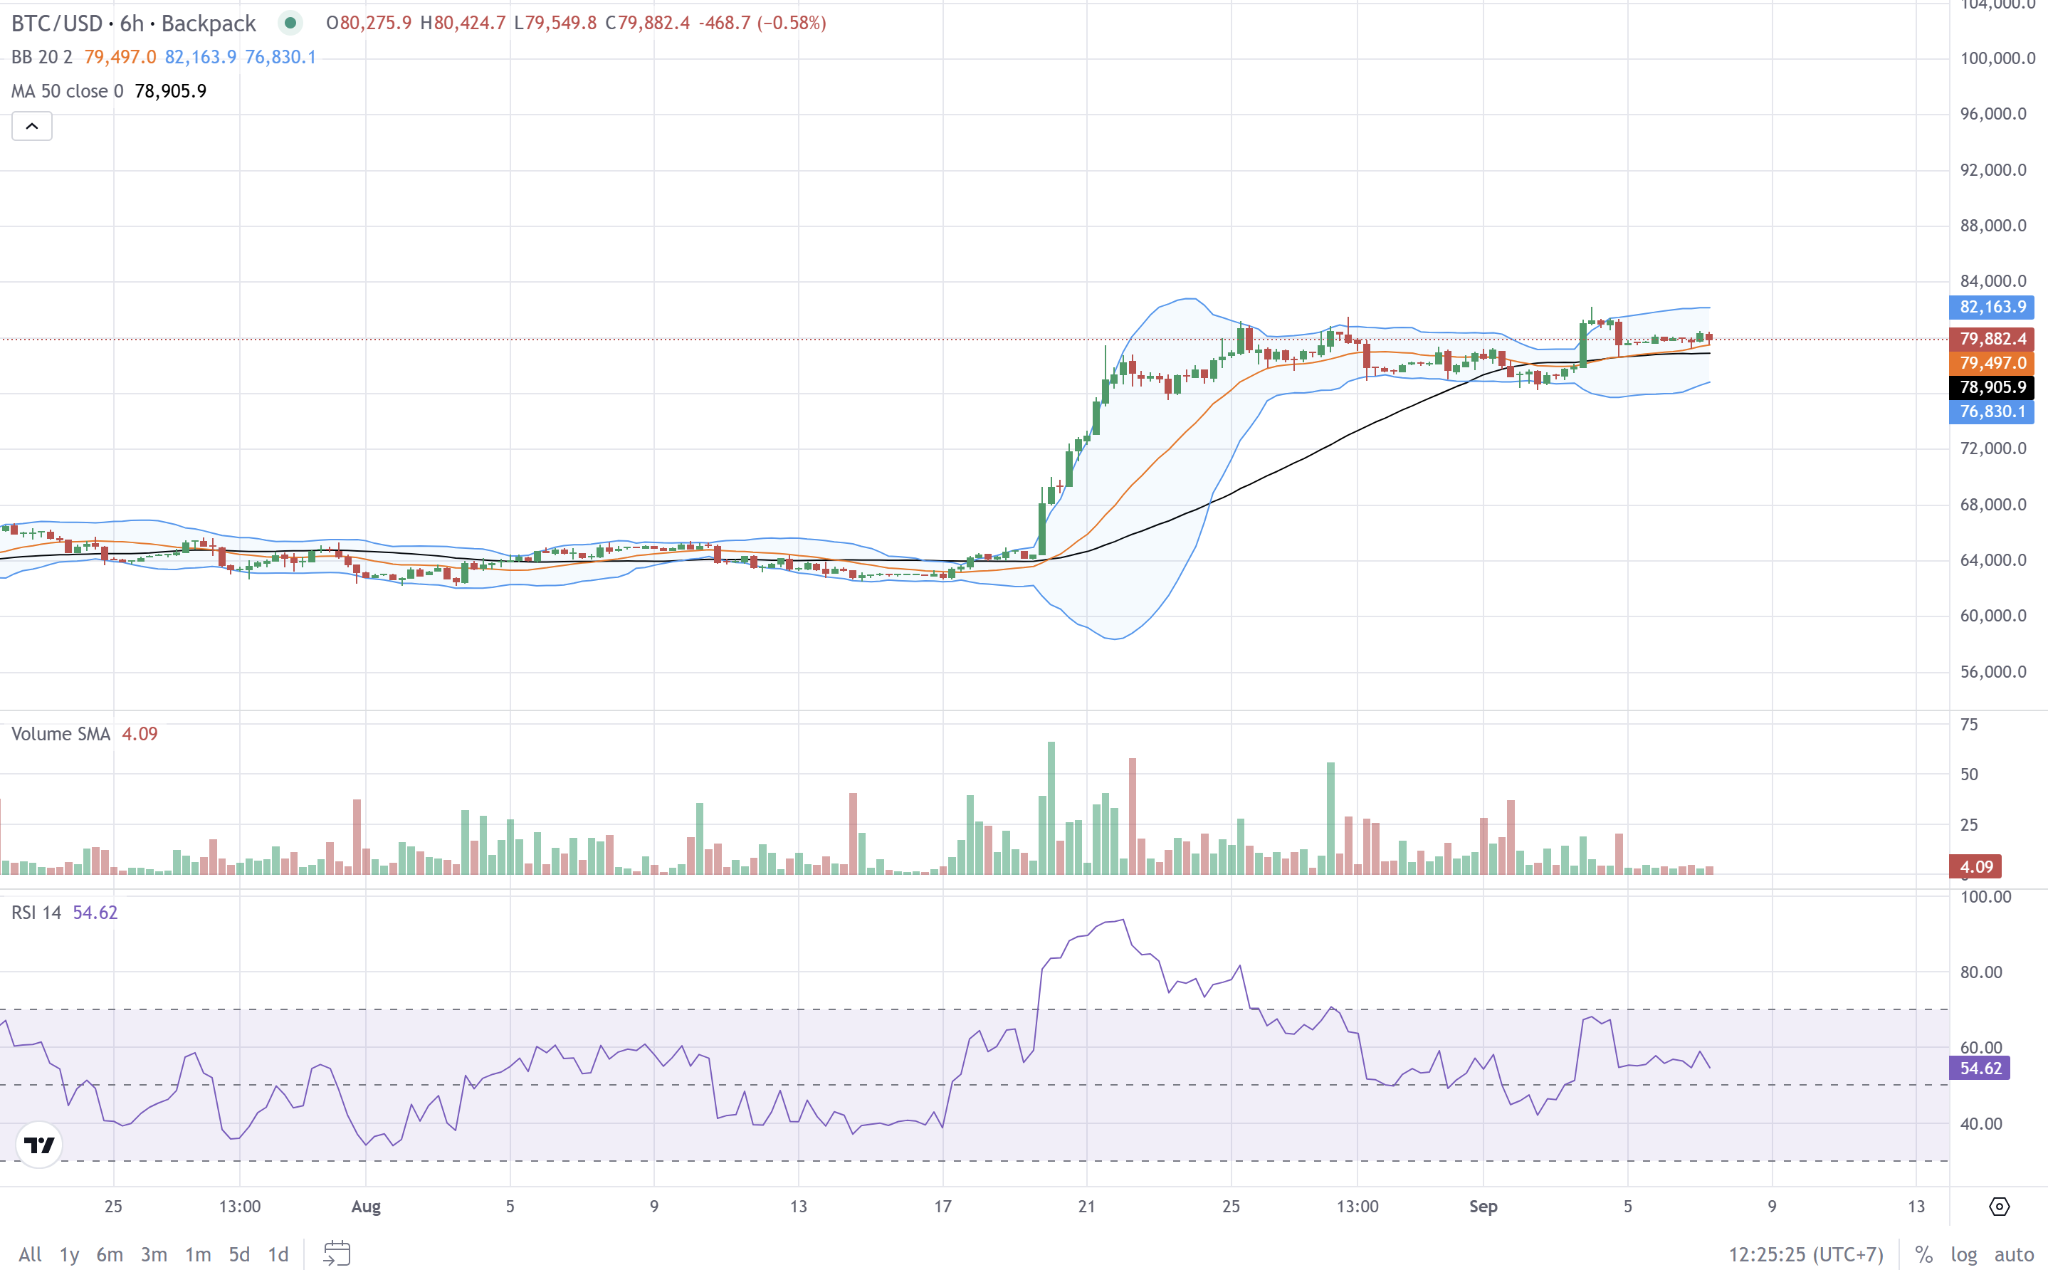
Suppose BTC breaks above a range it has held for weeks: the Bollinger Bands widen out of a narrow stretch, RSI climbs into the high 70s, volume prints several bars above its own average, and the 50-period moving average is still flat.
Read in order, those are one move rather than four signals, and the moving average is the slowest of them: it confirms the direction only after new bars enter its calculation.
Together those observations suggest trend, momentum, volatility, and participation are aligned. They do not guarantee the breakout will continue. A trader would still need to consider invalidation levels, position size, liquidity, leverage, news, and the possibility of a false breakout.
What Timeframe Should You Use for Technical Indicators?
Indicators change with timeframe, because the period count is measured in bars rather than in time: RSI 14 covers 14 hours on an hourly chart and 14 days on a daily one. RSI on a five-minute chart can show strong momentum while the daily chart remains neutral. A moving average relevant to a swing trader may be irrelevant to a short-term scalper.
The timeframe should match the trading horizon.
Some traders use multiple timeframes: a higher timeframe for the broader trend and a lower timeframe for entries or exits.
Do Technical Indicators Work in Crypto?
The calculations work the same way, but crypto has distinct market characteristics. Crypto trades continuously, so there are no session gaps and no opening auction, and the daily close that daily-timeframe indicators are built from is a cutoff on the clock rather than a market event. Weekend conditions can also differ from weekday sessions, with price moving on thinner participation.
Crypto traders may also monitor funding rates, open interest, liquidation levels, and onchain data. Traditional technical indicators can be useful, but they are only one part of the available information set.
Where Can You Use These Indicators on Backpack?
Every indicator in this article can be added directly to a Backpack chart, with trend and volatility tools drawn over price and momentum and volume tools in their own panes. Each one exposes its own settings, so the period and source can be changed rather than left at the default.
Backpack's charts carry more indicators than the five covered here, so the practical next step is to open a chart and test the ones that fit a given trading style.
Indicators are available on crypto charts and on equity charts alike. US equities and ETFs on Backpack are held as real security entitlements through Backpack Securities.
The Bottom Line
Moving averages, RSI, MACD, Bollinger Bands, and volume cover four core dimensions of technical analysis: trend, momentum, volatility, and participation. Their value comes from consistent interpretation, not from treating thresholds or crossovers as guaranteed trading signals. Traders should test indicators on the assets and timeframes they use and expect false signals.
Learn more about Backpack
Exchange | Wallet | Twitter | Discord | Reddit
Disclaimer: This content is presented to you on an “as is” basis for general information and educational purposes only, without representation or warranty of any kind. It should not be construed as financial, legal or other professional advice, nor is it intended to recommend the purchase of any specific product or service. You should seek your own advice from appropriate professional advisors. Where the article is contributed by a third party contributor, please note that those views expressed belong to the third party contributor, and do not necessarily reflect those of Backpack. Please read our full disclaimer for further details. Digital asset prices can be volatile. The value of your investment may go down or up and you may not get back the amount invested. You are solely responsible for your investment decisions and Backpack is not liable for any losses you may incur. This material should not be construed as financial, legal or other professional advice.